Studio
The visual companion. Vue 3 + Vite + VueFlow. Reads Nwire primitives natively — no instrumentation, no agents.
pnpm dlx @nwire/studio # or `pnpm dev` in packages/nwire-studio/Open http://localhost:7777.
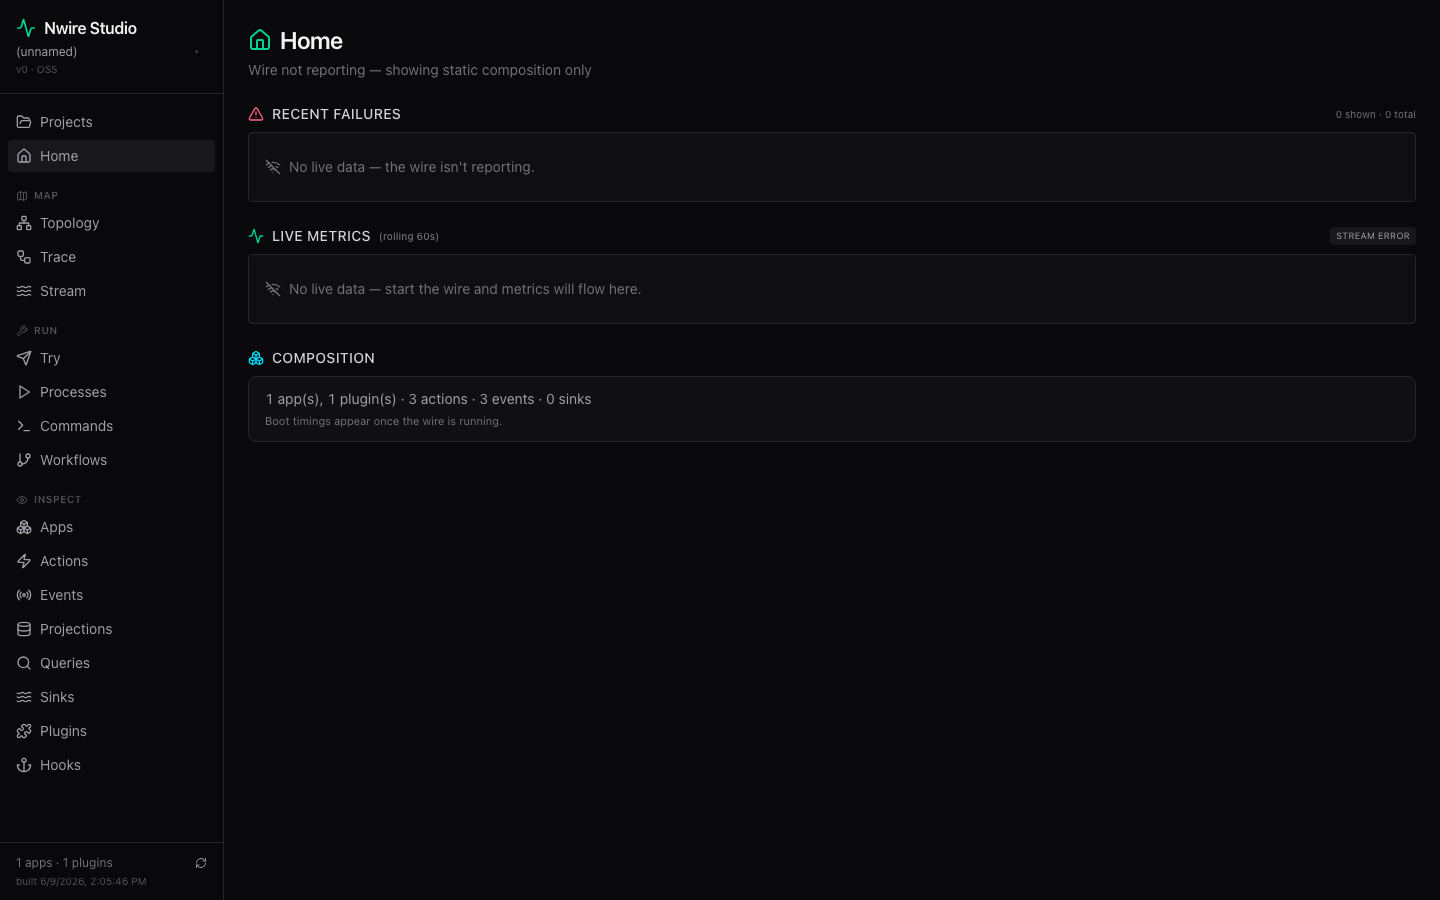
Every screenshot below is captured live from examples/moderation-queue — what you see is exactly what Studio renders against a freshly scanned .nwire/manifest.json.
What's in Studio
The nav is grouped into three surfaces — Map (the system in motion), Run (operate it), Inspect (browse the static surface).
| Group | Page | What it shows |
|---|---|---|
| Projects | Catalog of every workspace Studio has ever opened. | |
| Home | Per-project dashboard: recent failures, boot summary, composition stats. | |
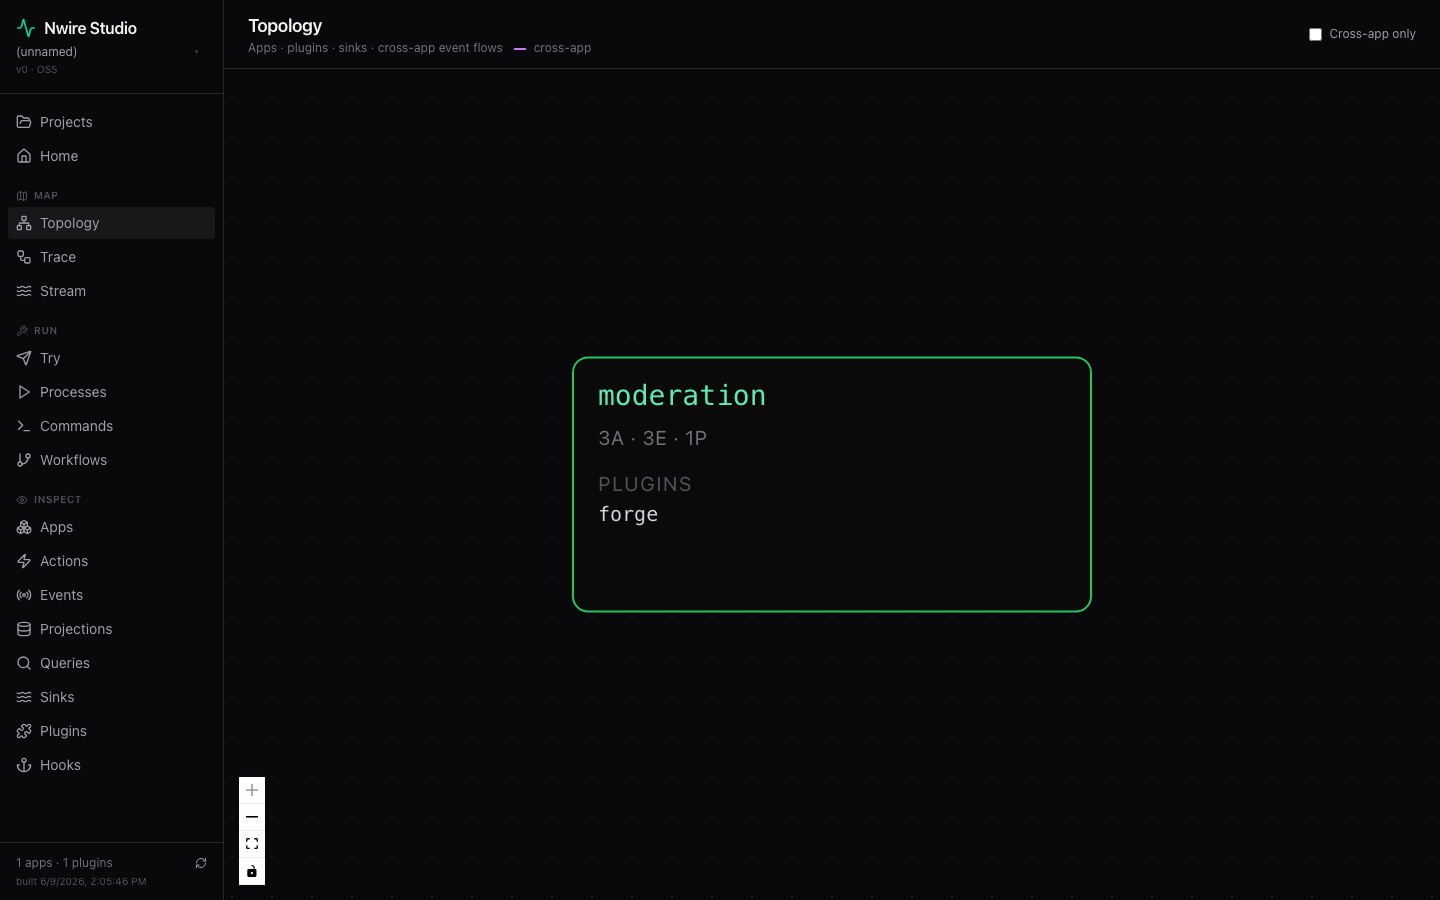
| Map | Topology | Apps as nodes, plugins listed inline, outbound sinks visible, cross-app event flows as edges. |
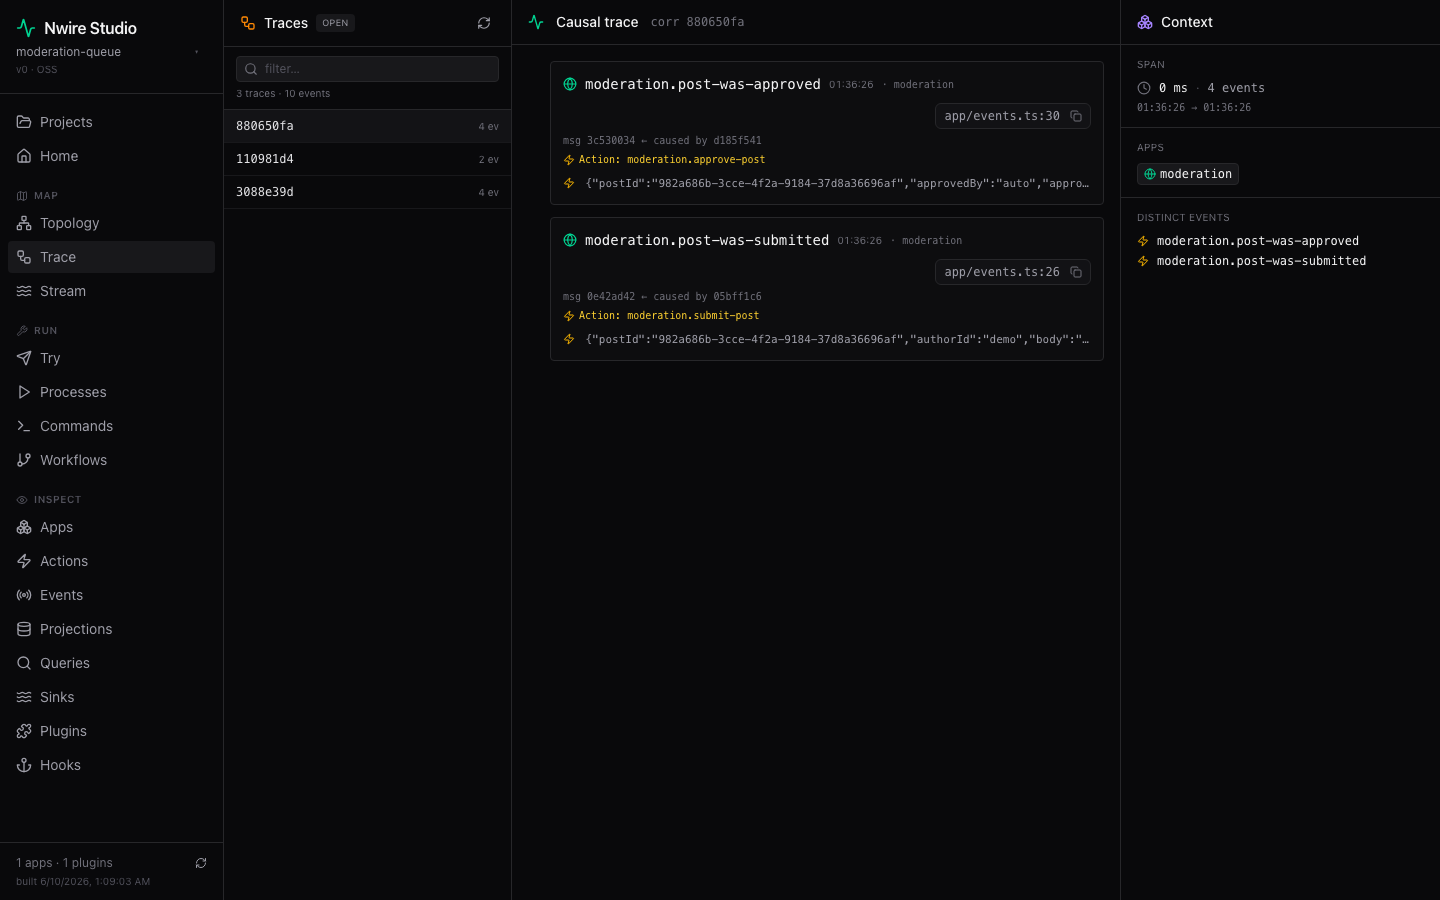
| Map | Trace | Causal tree per correlationId. Click an event → walk its parents and children. |
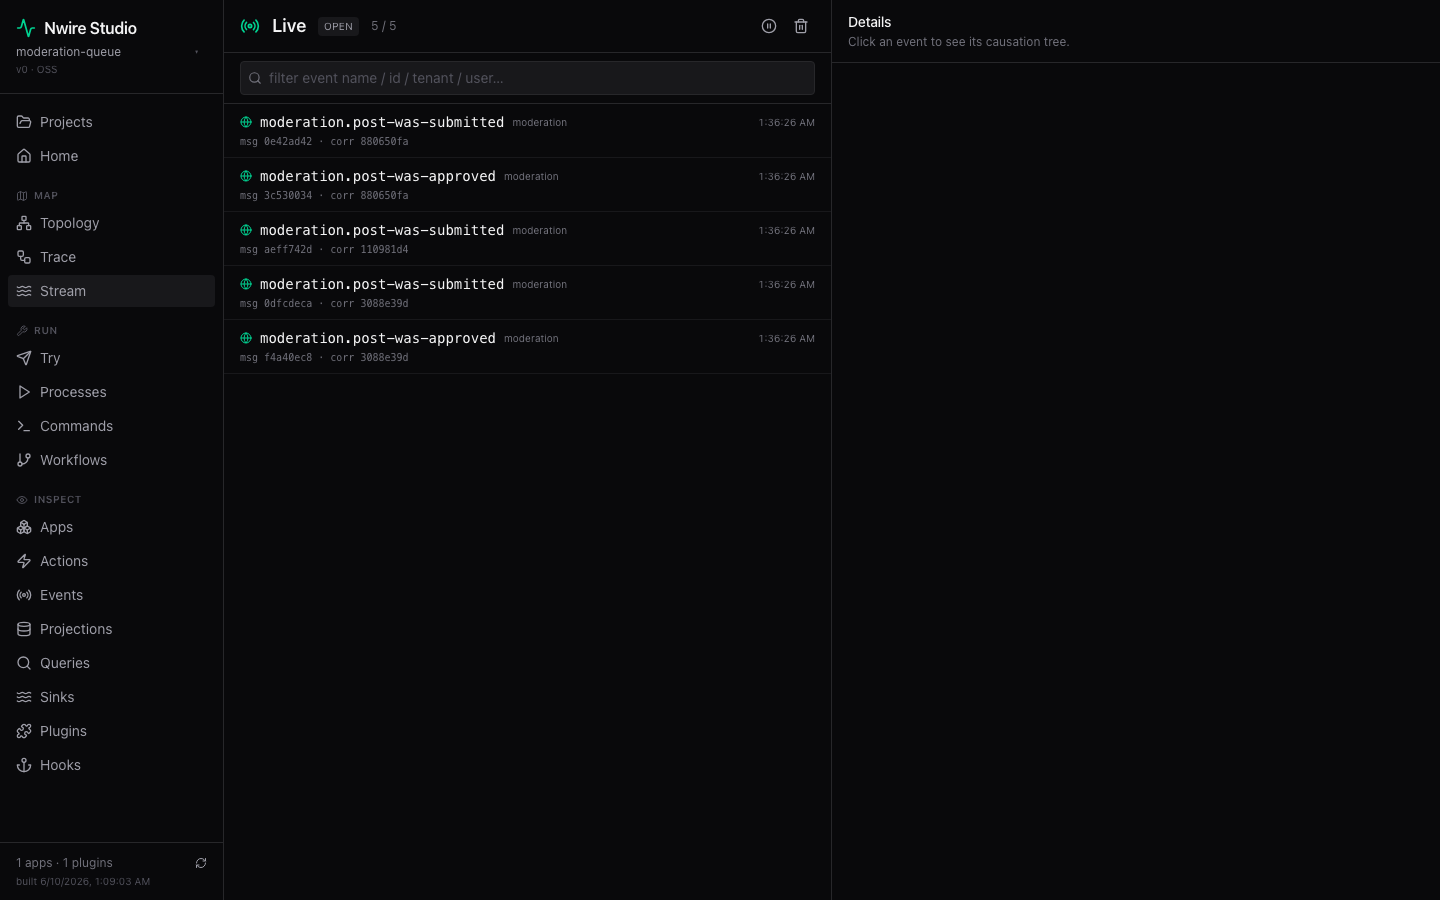
| Map | Stream | Live event firehose via SSE. |
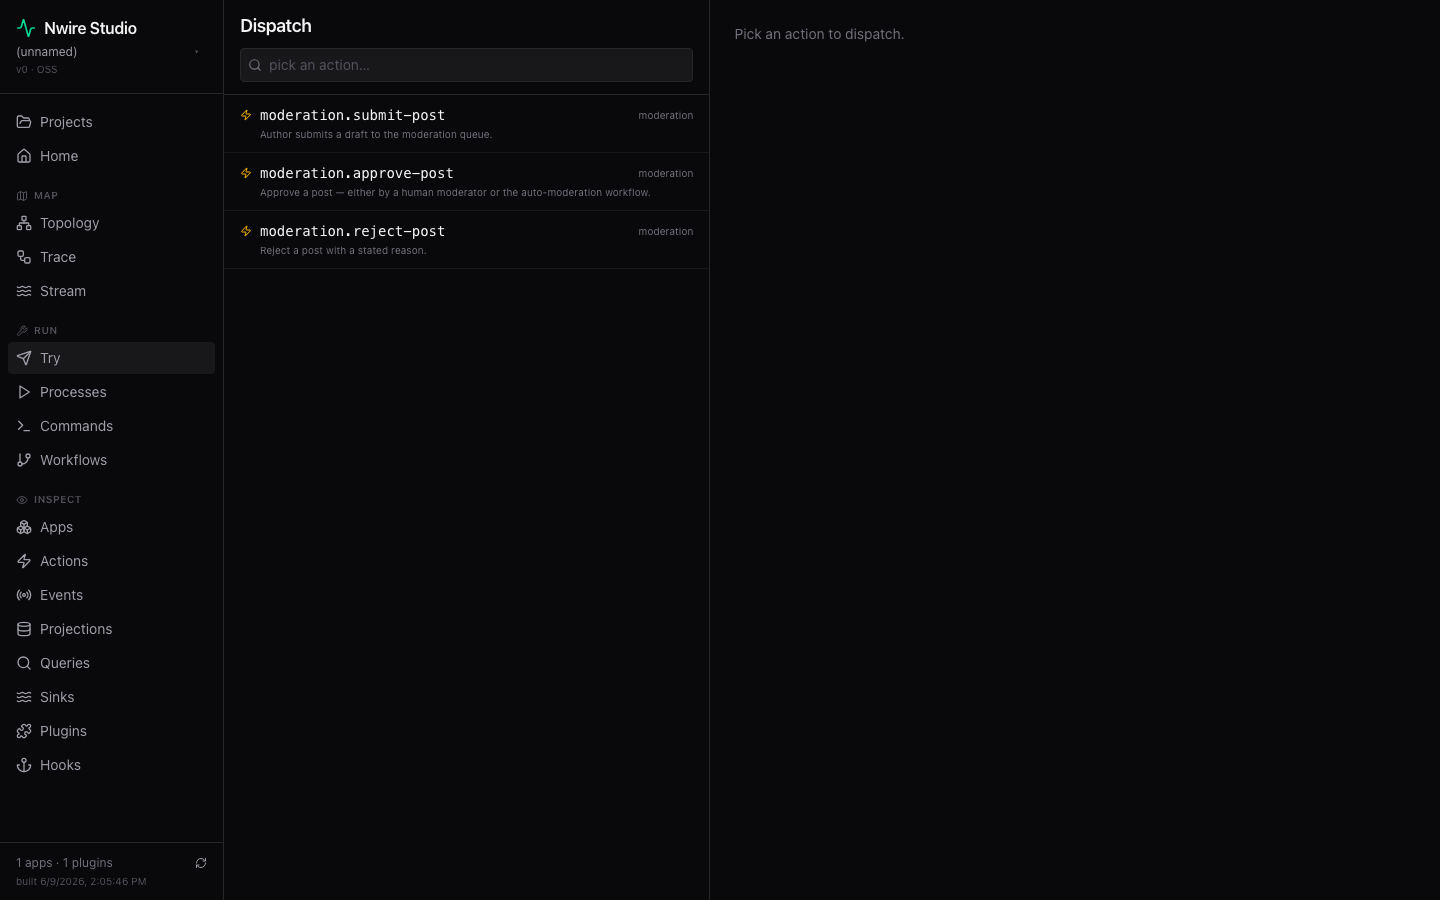
| Run | Try | Form-from-schema: pick any action, fire it with JSON scaffolded from its zod schema. |
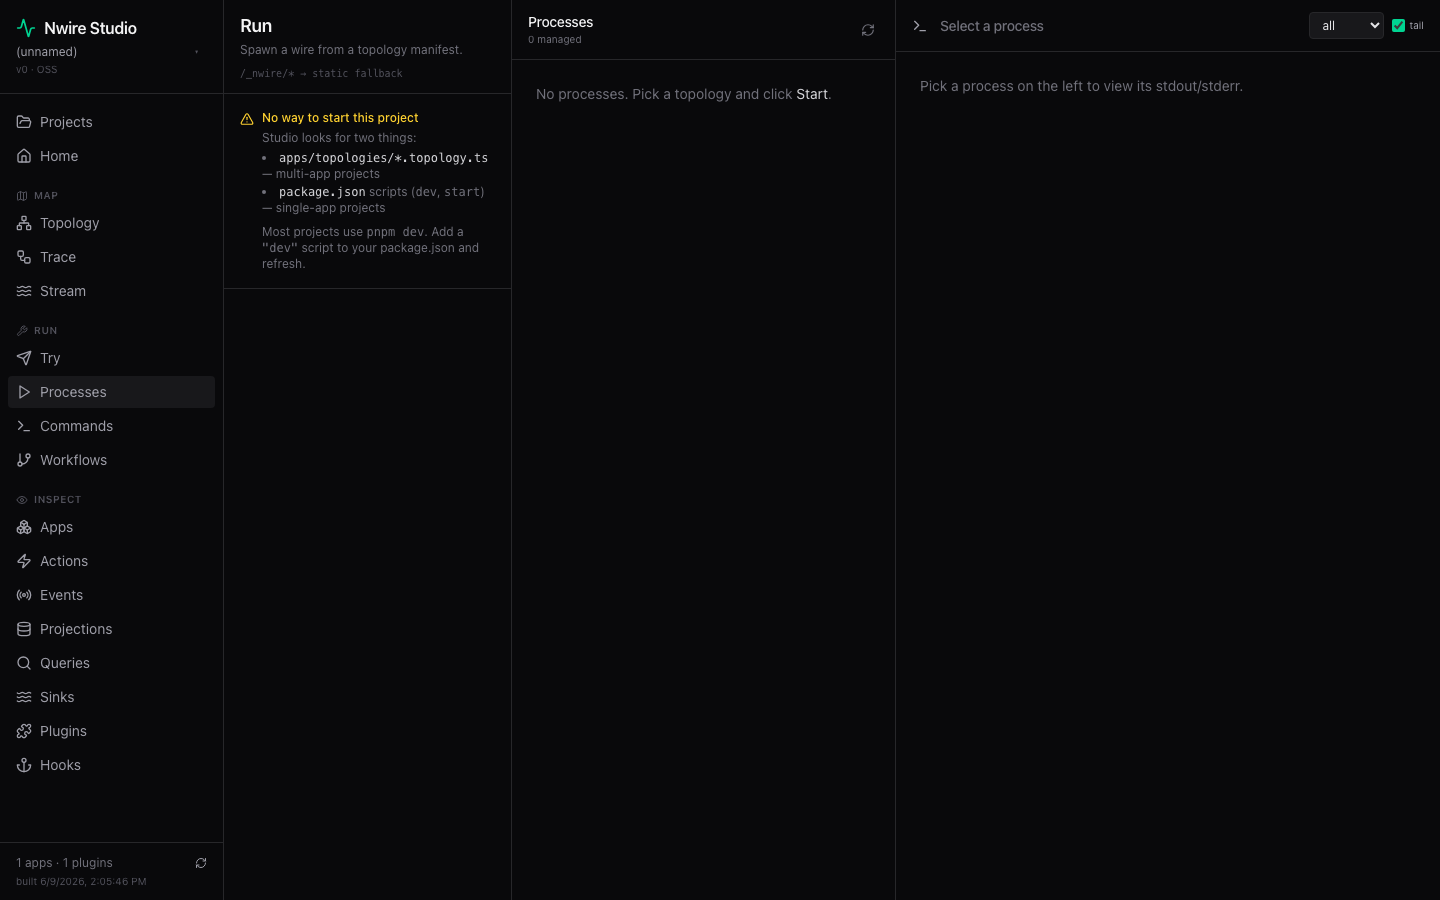
| Run | Processes | Pick a process, click Start, stdout streams in the page. |
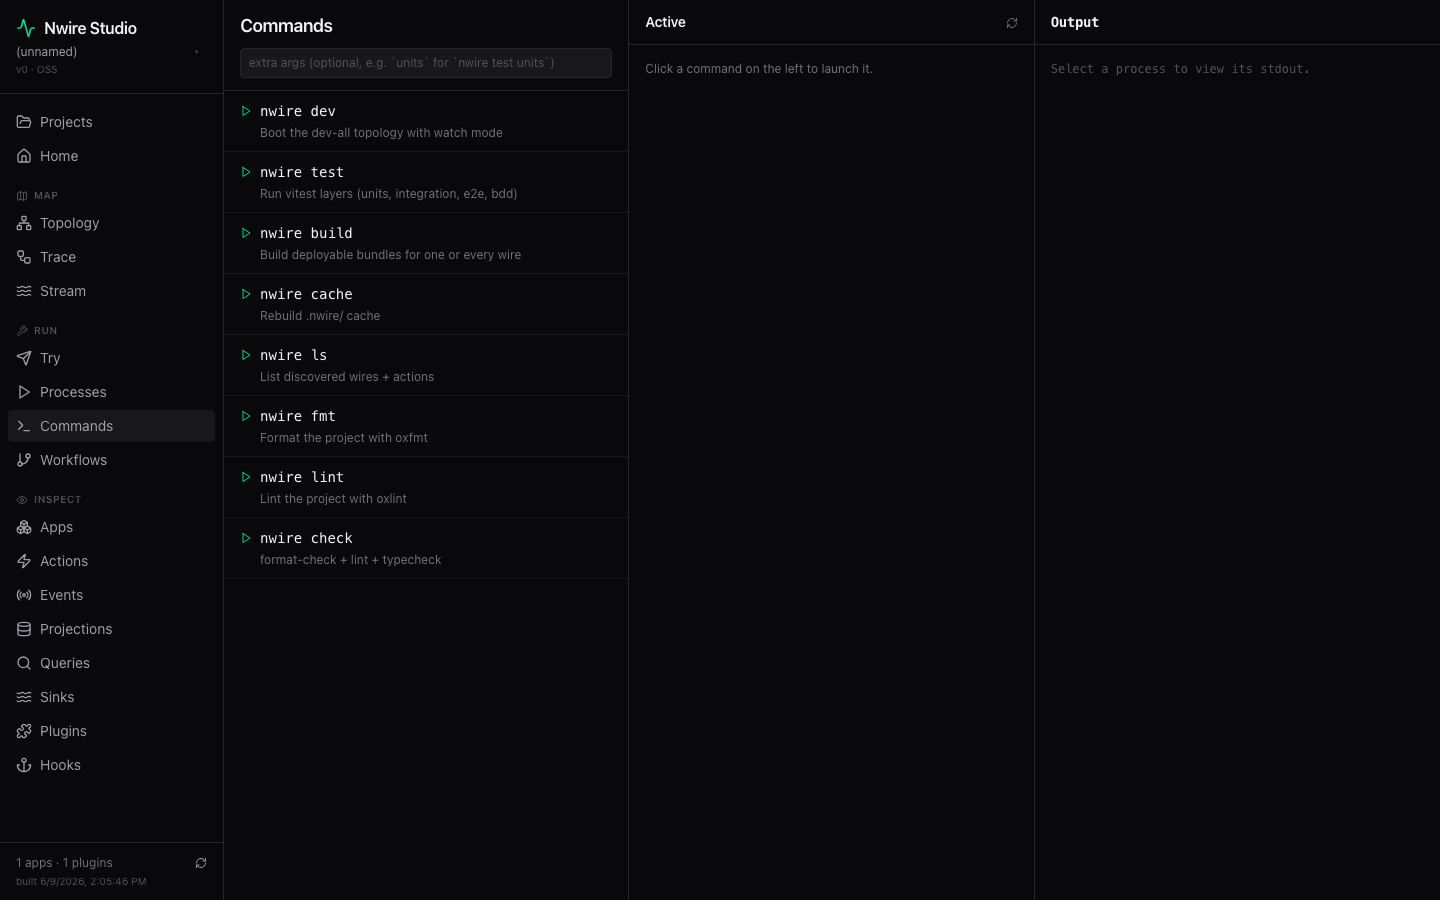
| Run | Commands | The please CLI surface — operator scripts and registered actions/queries. |
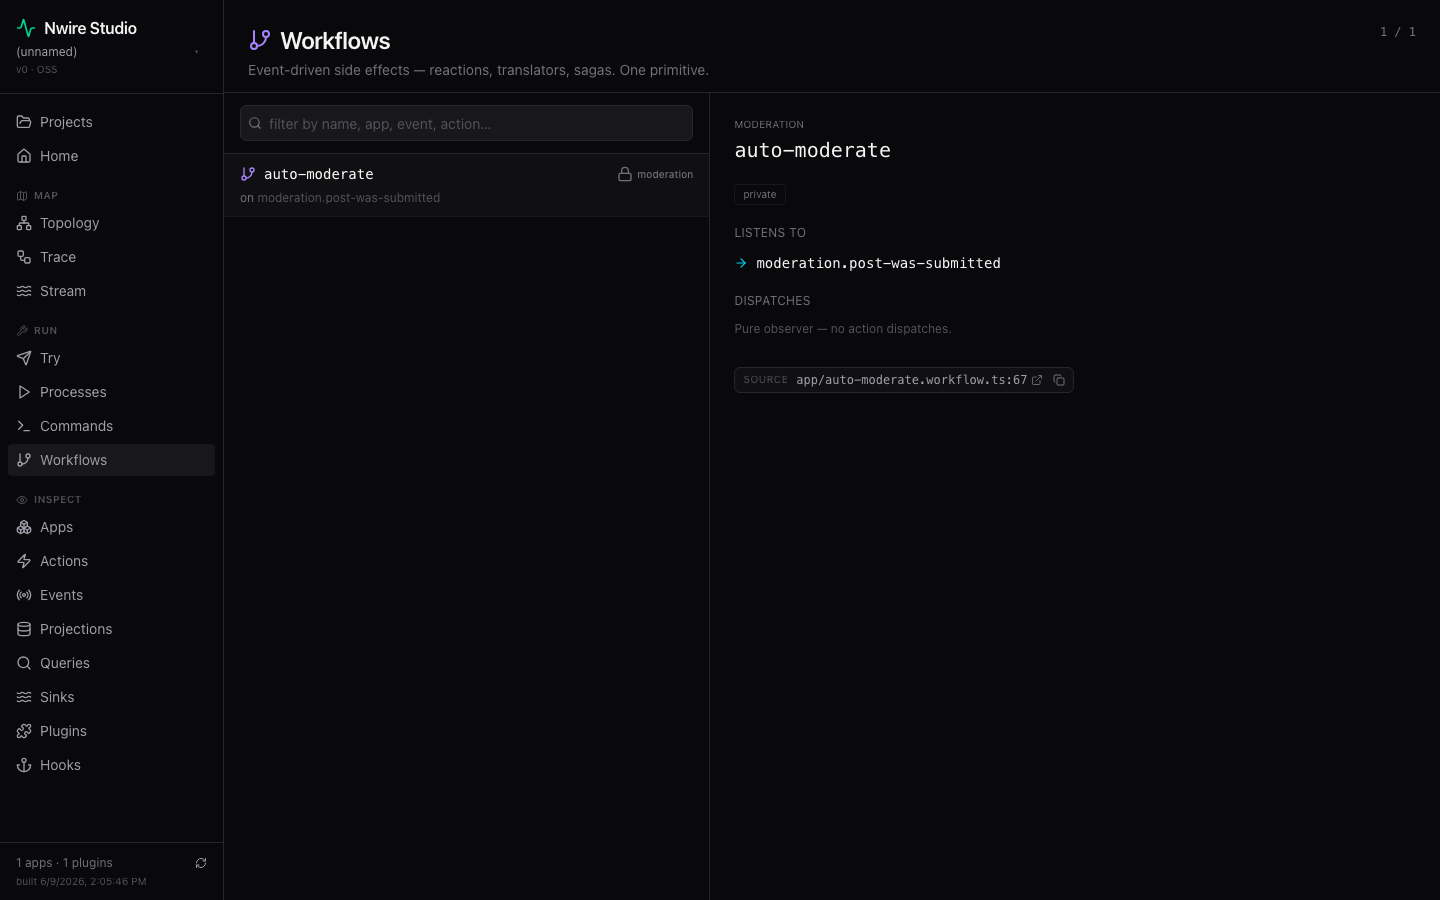
| Run | Workflows | Workflow defs + which events they subscribe to and which actions they dispatch. |
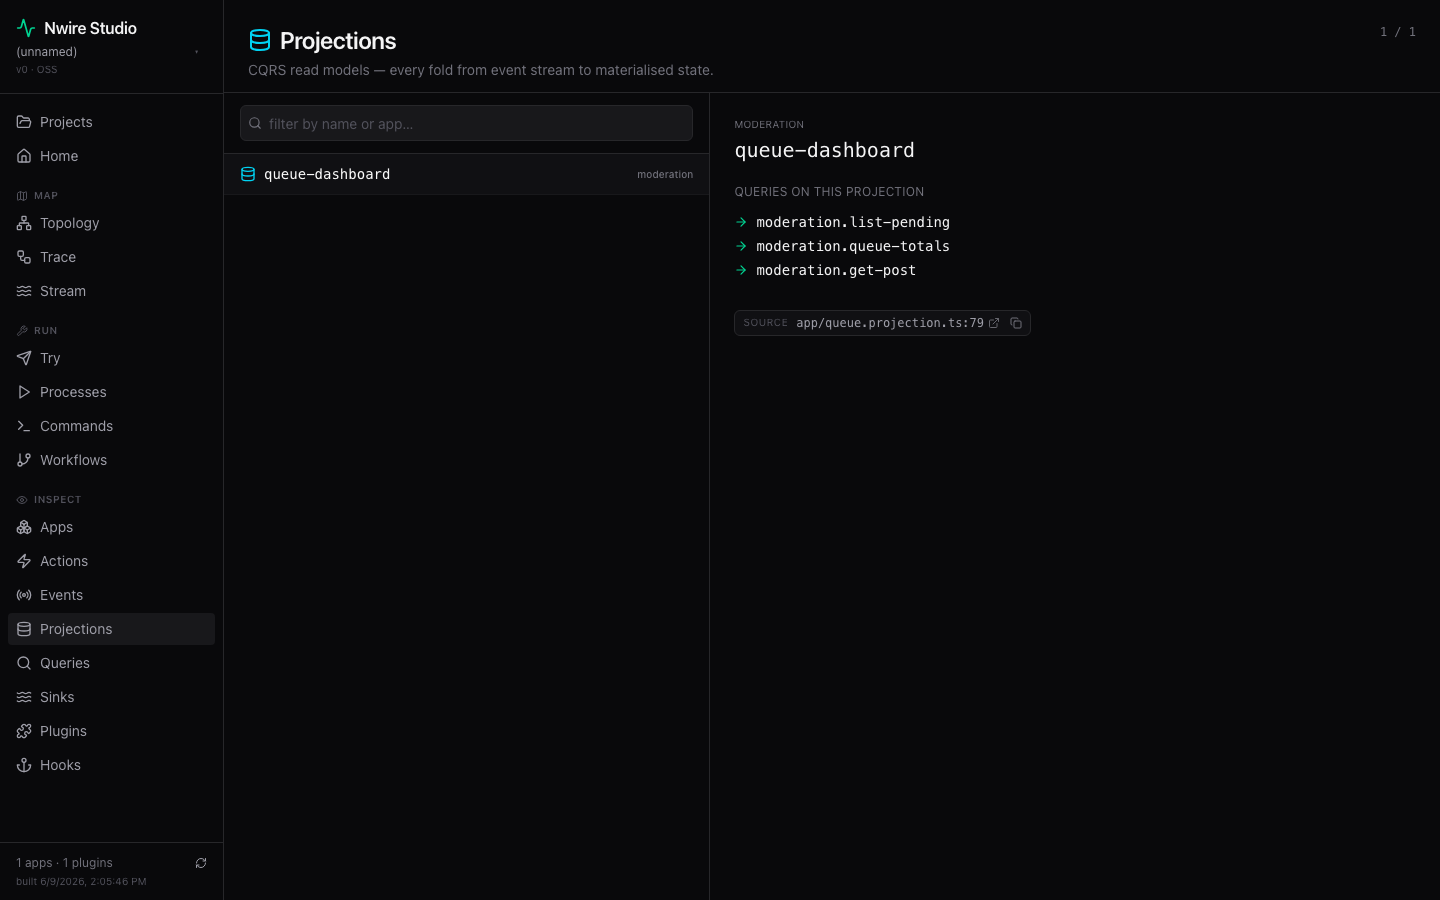
| Inspect | Apps | Every App with its plugin stack, primitive counts, and outbound sinks. |
| Inspect | Actions | Searchable list + detail panel: schema, retry/policy badges, persona, journey, SLO. |
| Inspect | Events | Catalog with public/internal indicator, per-event flow (producer → consumers). |
| Inspect | Projections | CQRS read models — each fold with the events it listens to. |
| Inspect | Queries | Read endpoints — projection-backed or direct-handler. |
| Inspect | Sinks | Outbound delivery chain — every stage by position (early / middle / terminal). |
| Inspect | Plugins | Installed plugins per app — bundle-mode forge, sub-plugins, custom. |
| Inspect | Hooks | Every materialised framework hook slot and its chain length. |
Map — the system in motion
Topology — apps as nodes, plugins listed inside, outbound sinks visible. Edges are cross-app event flows.
Trace — causal tree per correlationId. Click an event, walk its parents and children.
Stream — live event firehose via SSE.
Run — operate the system
Try — form-from-schema. Pick any action, fire it with JSON scaffolded from its Zod schema.
Every fire is a POST /_nwire/dispatch against the running wire — the same dispatch contract MCP's dispatch_action speaks. Errors come back coded, not raw: a zod-invalid input renders validation_failed with the failing field, an unknown name action_not_found, and a handler throw an opaque internal_error unless the wire runs with exposeErrors. The optional user-id / tenant fields thread into the handler's envelope, so you can exercise an action as a specific caller.
Processes — start dev with custom port + env vars, stream stdout, recognise processes started in another terminal (via .nwire/processes/*.json).
Commands — the please CLI surface — operator scripts and registered actions / queries.
Workflows — workflow defs with subscribed events and dispatched actions.
Inspect — browse the surface
Apps — every App with its plugin stack, primitive counts, and outbound sinks.
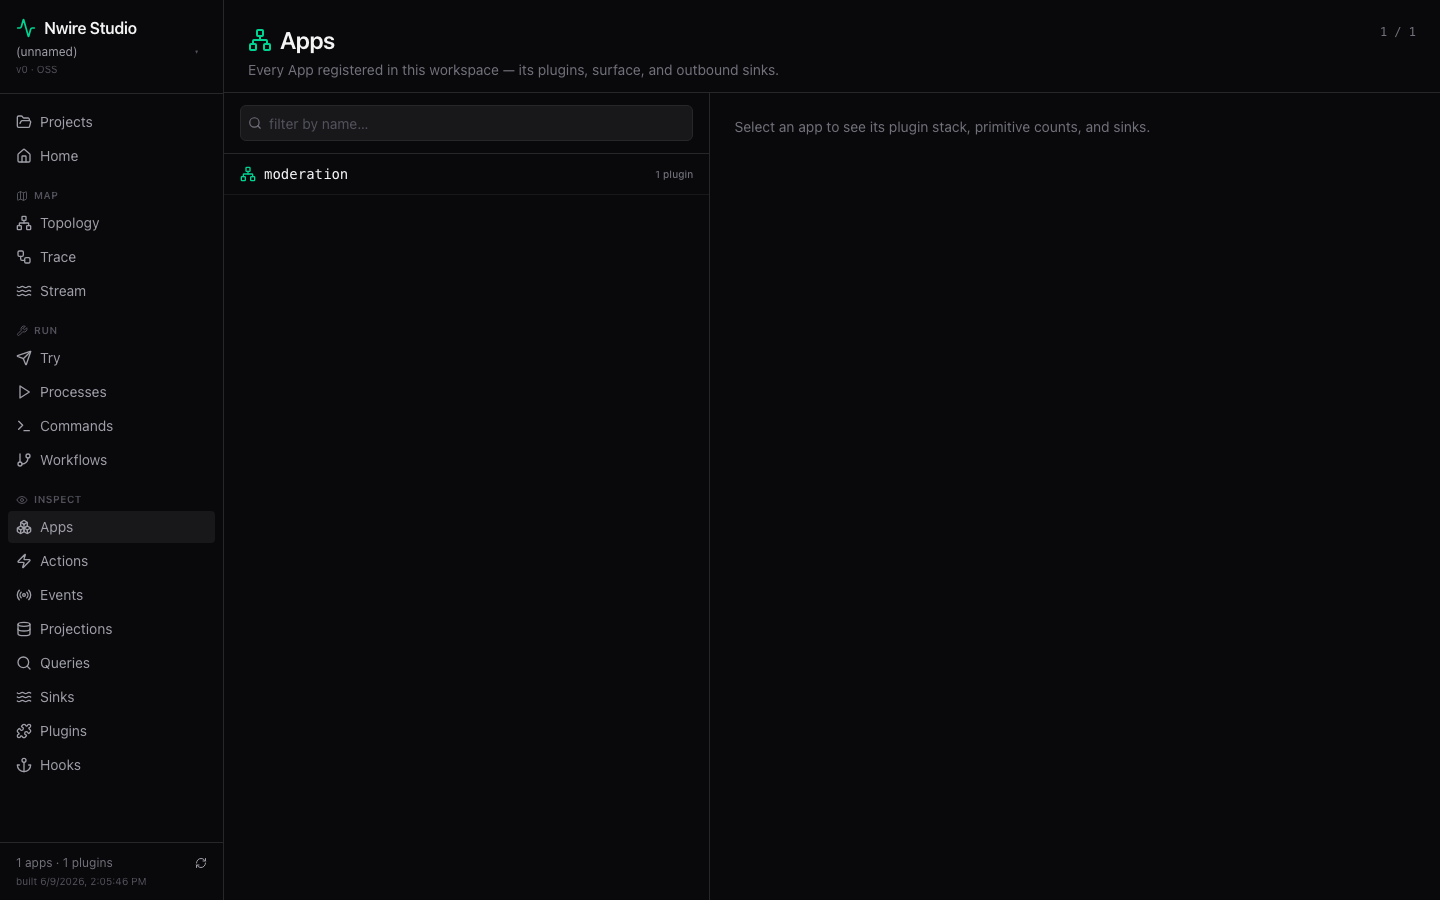
Actions — searchable list + detail panel: input schema, persona, journey, source link.
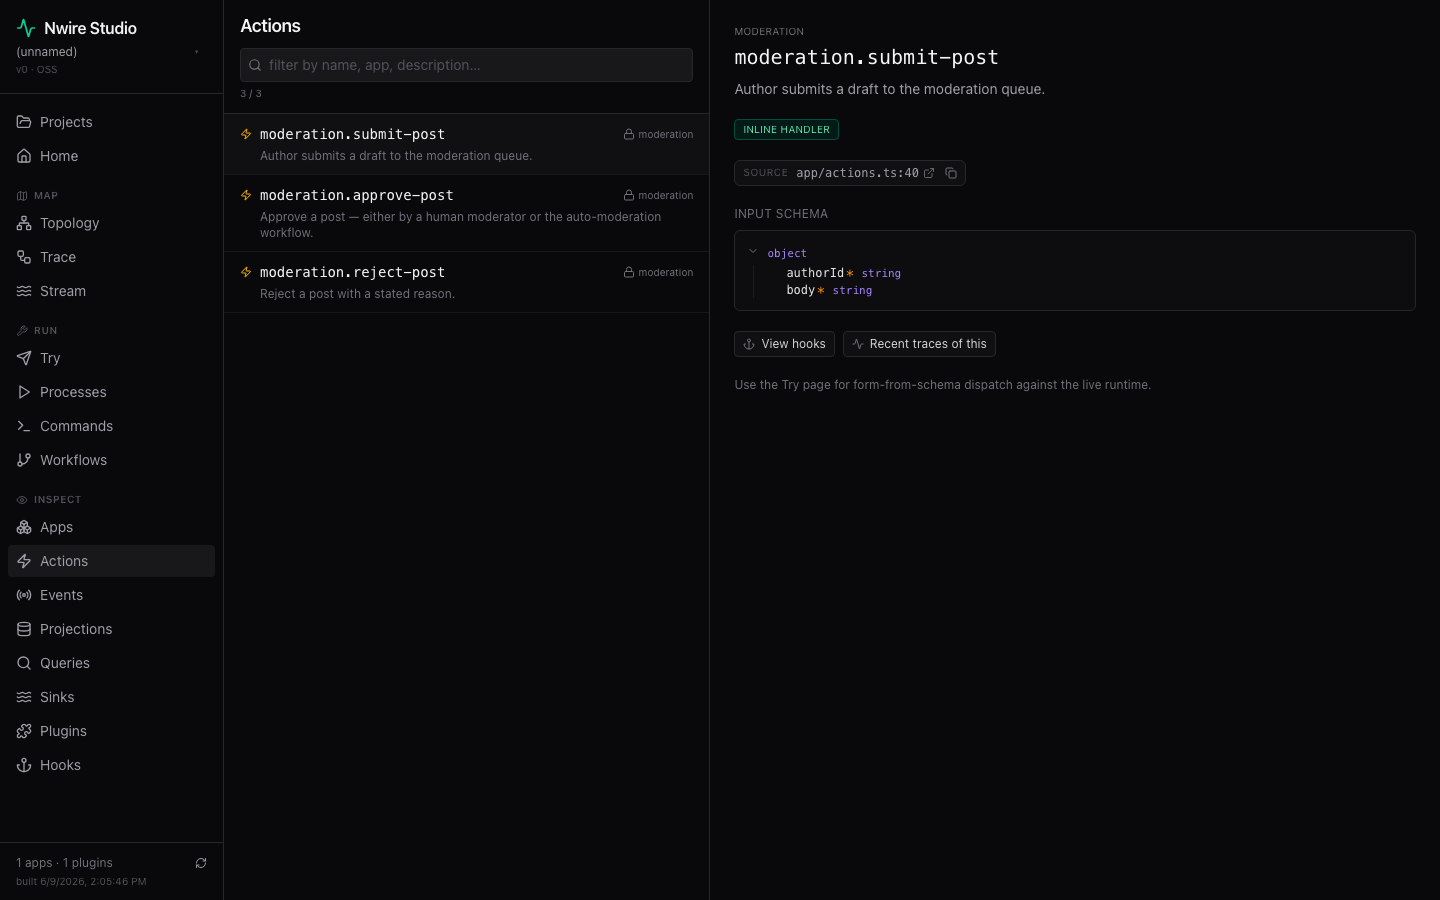
Events — catalog with the .public() gate badge + per-event producer/consumer flow.
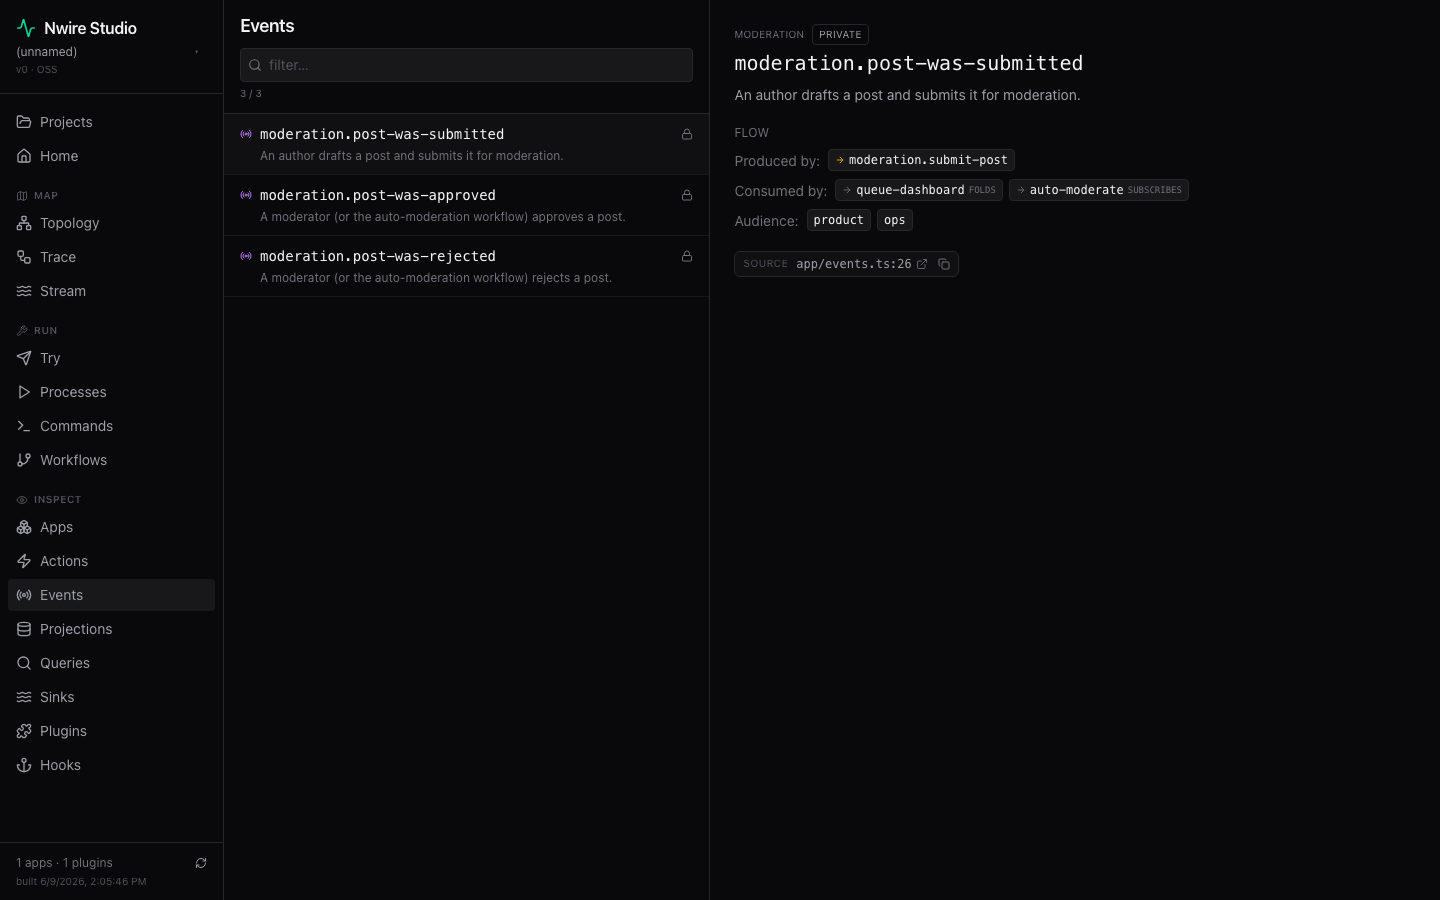
Projections — CQRS read models. Each fold with the events it listens to, cross-linked to the queries reading it.
Queries — read endpoints — projection-backed or direct-handler.
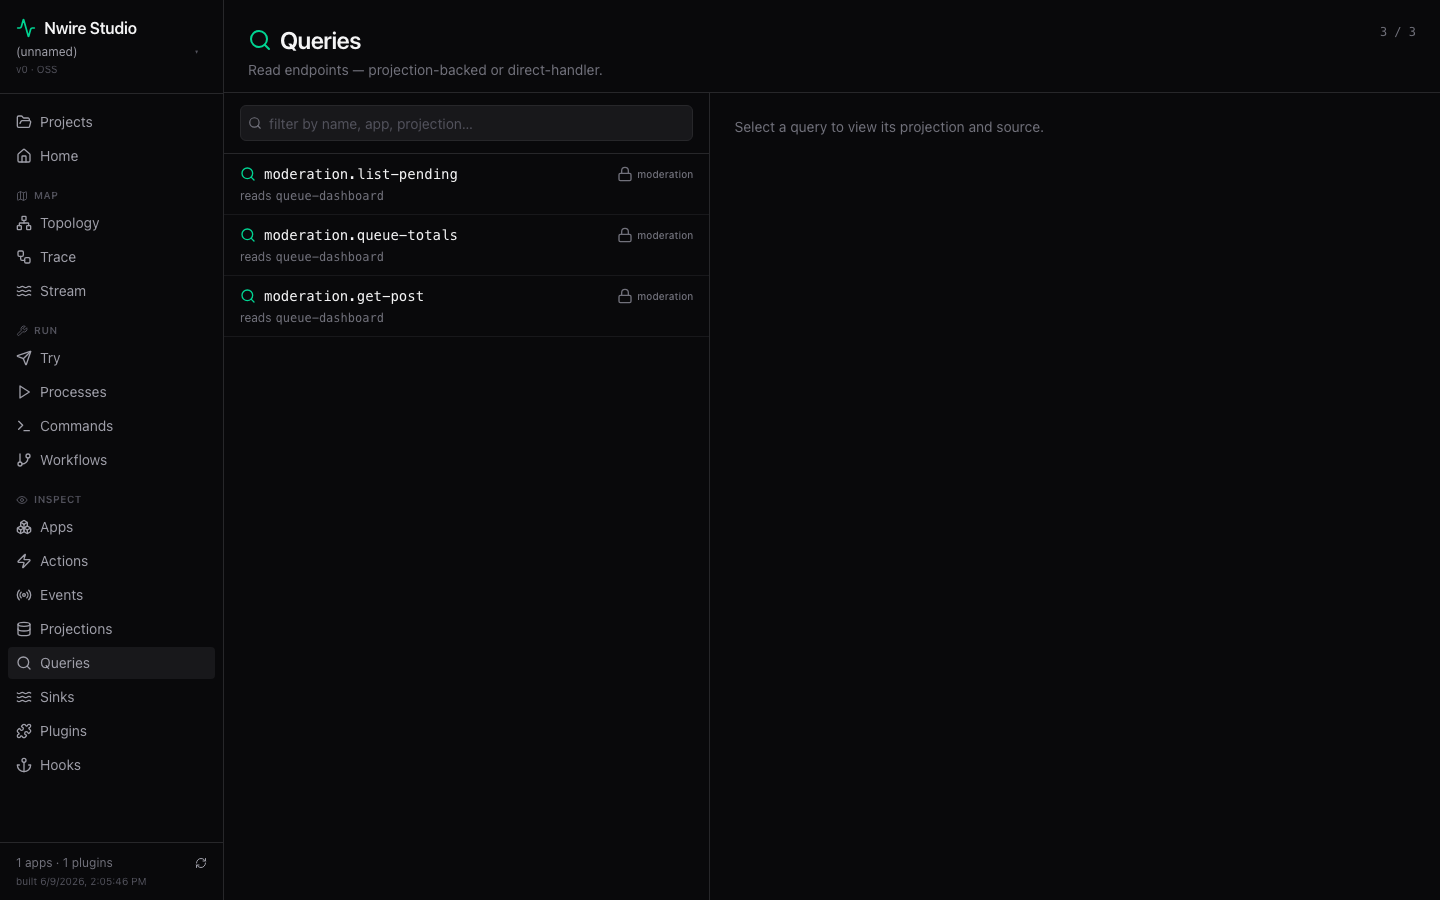
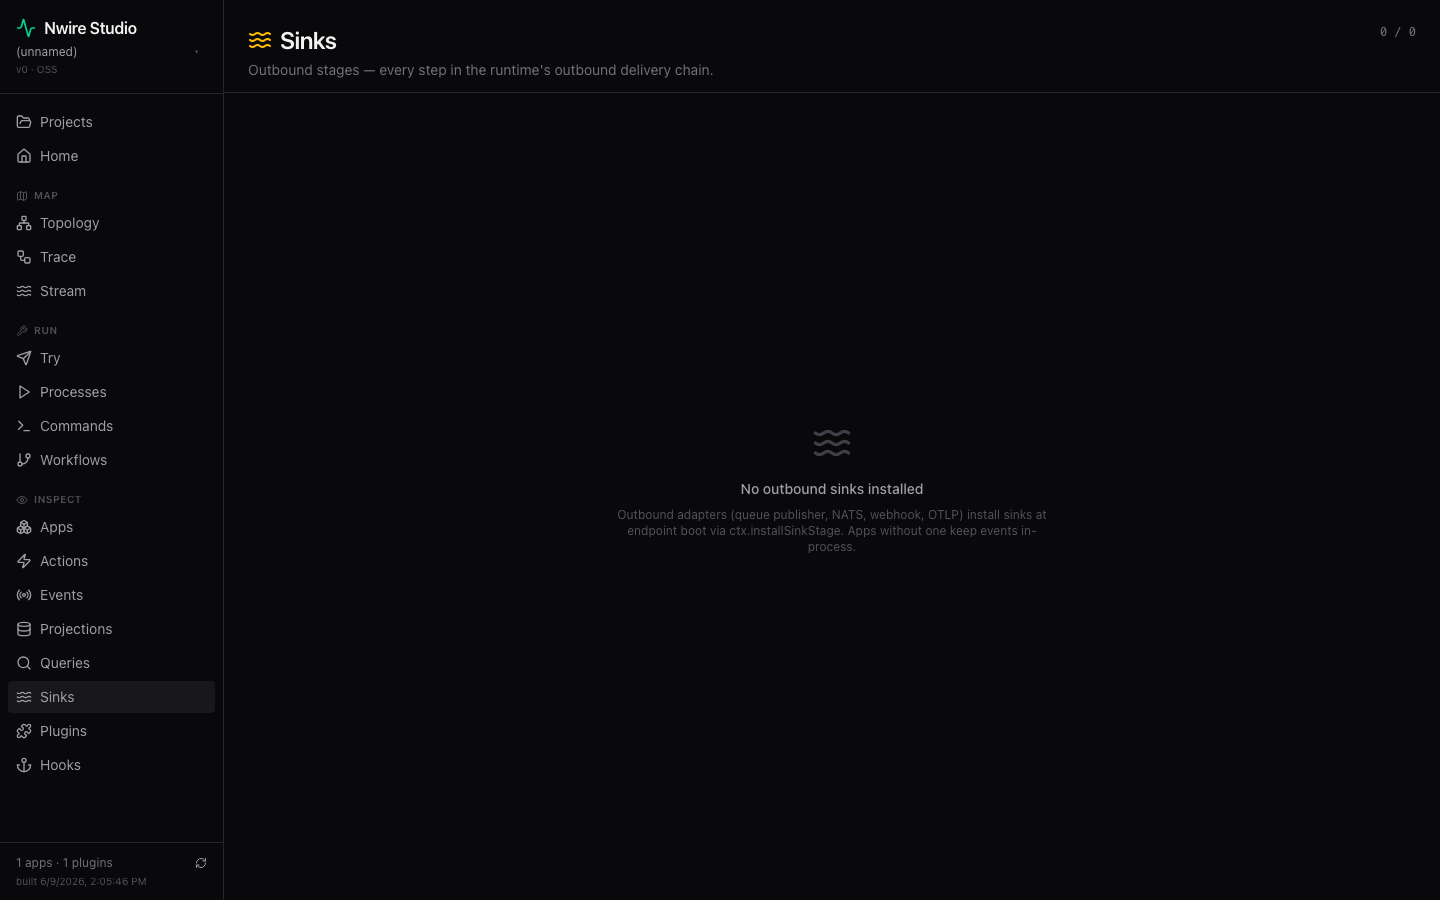
Sinks — outbound delivery chain — every stage by position (early / middle / terminal). Empty when no outbound adapter is installed.
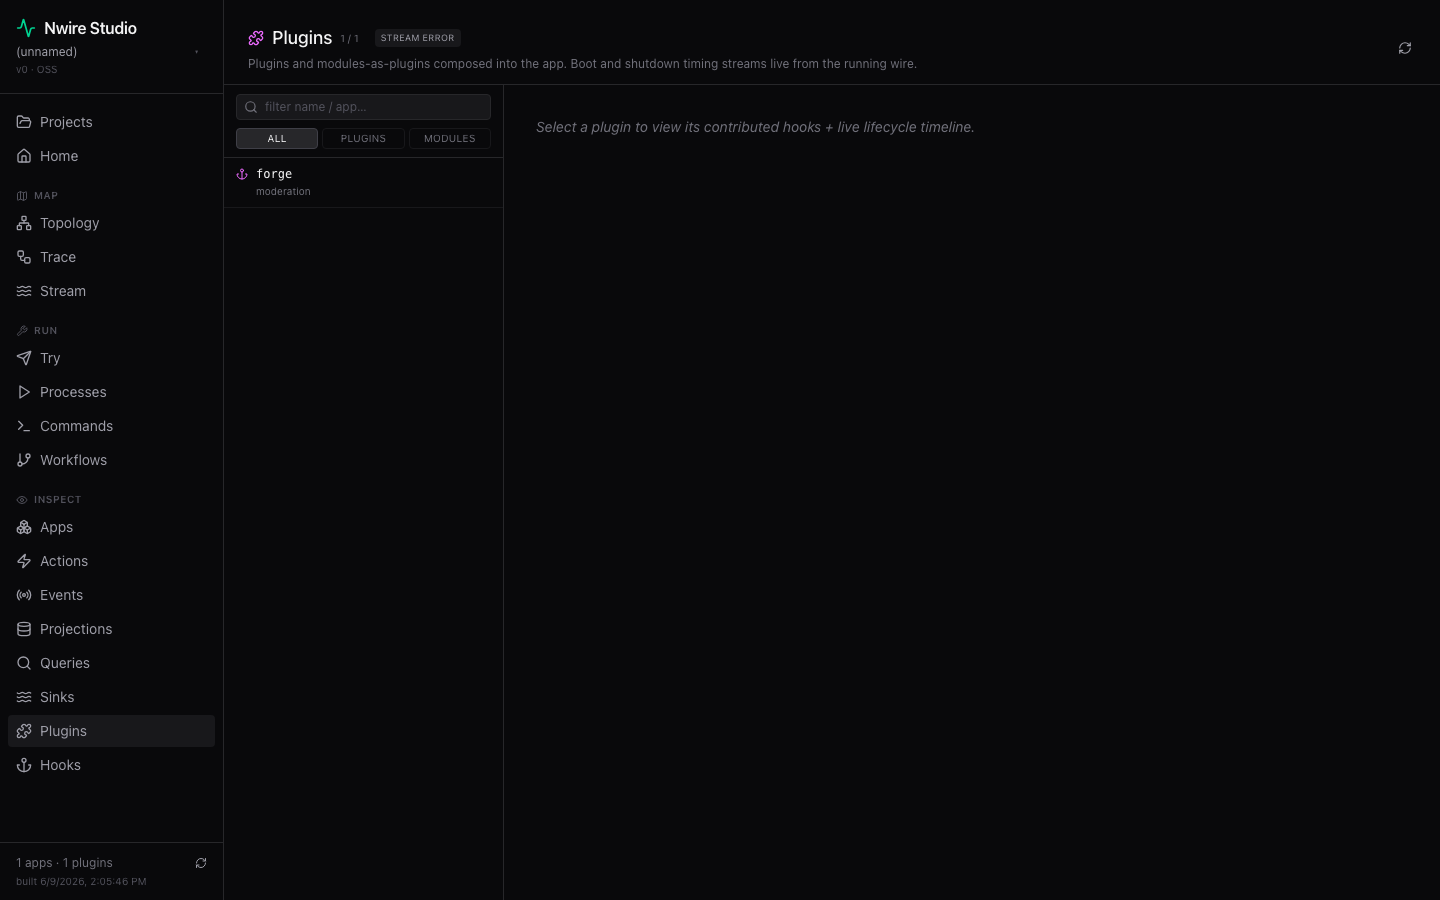
Plugins — installed plugins per app — bundle-mode forge, sub-plugins, custom.
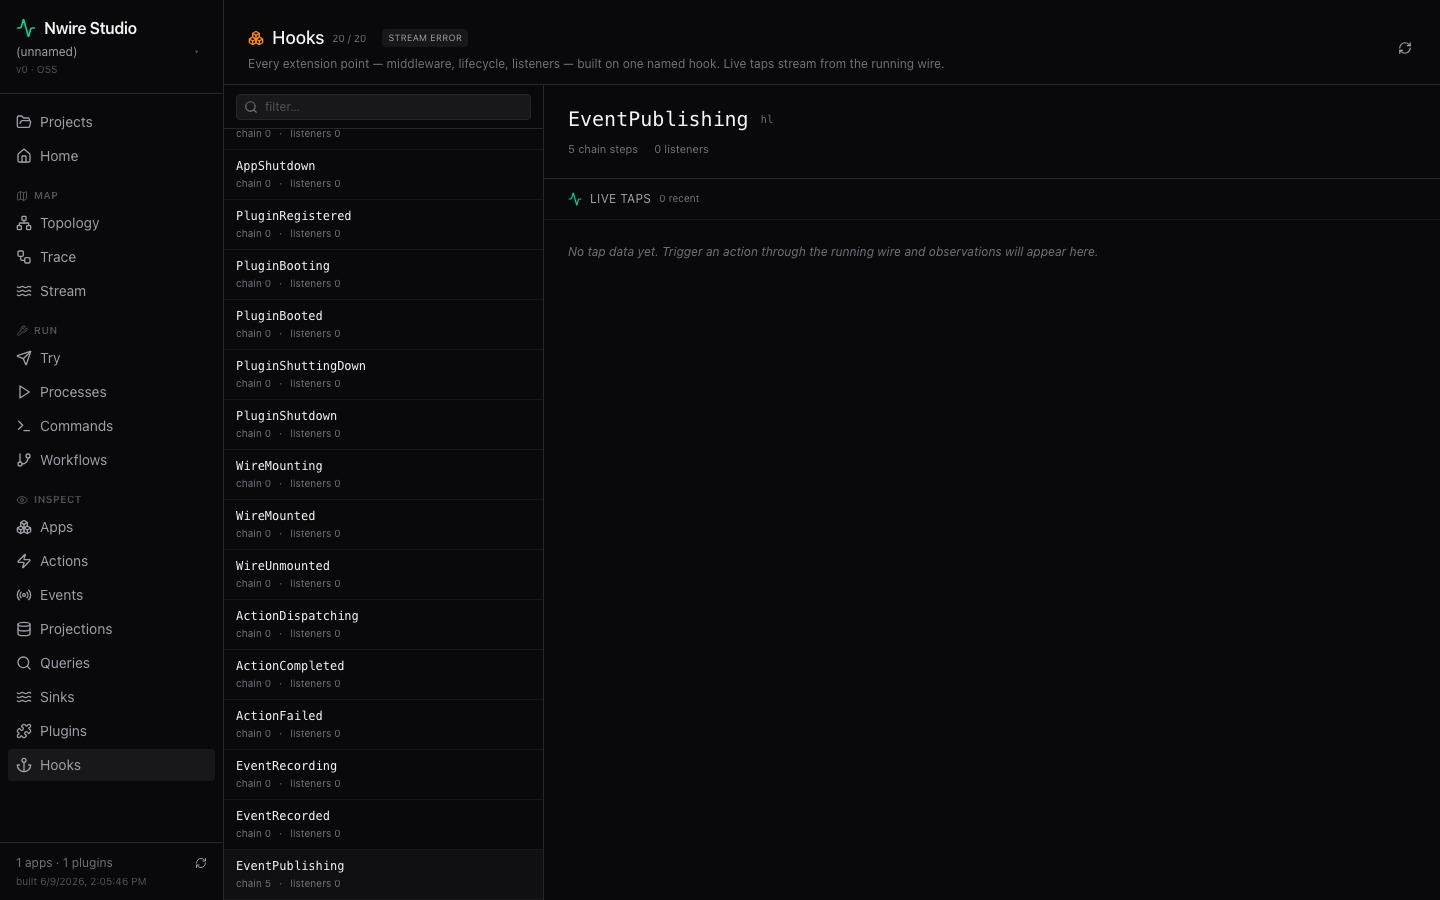
Hooks — every materialised framework hook slot and its chain length. The core LocalDelivery chain is where forge attaches at fixed priority slots (idempotency 1000, actors 800, projections 600, workflows 400).
Data sources
Studio reads from two places:
.nwire/manifest.json— built bynwire cache, gives every primitive's static metadata (persona, SLO, schema, etc.)/_nwire/*— runtime introspection from the wire'shttpKoa({ inspect: true })endpoints
The dynamic /_nwire/* proxy in Studio's Vite middleware routes requests to the most-recently-started managed process (or the default NWIRE_INSPECT_URL if no process is up).
Play Trace
The flagship DX feature. Fetches /_nwire/telemetry/recent, groups by correlationId, walks each story chronologically, lights up the matching sticky on the EventStorm canvas with an amber glow. 1×/2×/4×/8× playback speed. Distinct correlations get a pause between them so different stories feel separated.
Studio-as-runner
nwire studio # boots Studio's Vite dev server + supervisorInside Studio, the Run page lets you:
- Pick a topology from
apps/topologies/*.topology.ts - Pick a port (defaults 3000)
- Click Start — the supervisor spawns
pnpm exec vite-node apps/run.tswithNWIRE_TOPOLOGY=<name>+PORT=<port> - Health check polls
/_nwire/manifestuntil the wire is ready - Stdout / stderr stream live via SSE
- The dynamic proxy auto-routes Studio's
/_nwire/*calls at the new process - Live / Dispatch / EventStorm all light up automatically
No separate terminal. The same Studio sees your code, your live traces, and the running process.
OSS / Cloud split
| Feature | Local OSS | Hosted Cloud (later) |
|---|---|---|
| Live event stream | ✓ | ✓ + retained history |
| Actor / projection browser | ✓ | ✓ + multi-deploy |
| EventStorm canvas | ✓ | ✓ + collaboration + sync to code |
| Dispatch UI | ✓ | ✓ |
| Run / process supervisor | ✓ | ✓ + Cloud-managed processes |
| Distributed traces | ✓ (single process) | ✓ + cross-service correlation |
| Multi-environment | — | ✓ (dev / staging / prod) |
| Team / sharing | — | ✓ |
| Alerts | — | ✓ |
| AI debug | — | ✓ |
OSS = the local experience. Cloud = persistence, multi-deploy, team features. Same UI, same concepts, same muscle memory.
See also
- Studio guide — practical recipes
- Telemetry — the data Studio consumes
- Topology — what Studio supervises